
Company size · 5 min read
Small-cap, mid-cap, large-cap: what do they actually mean?
Compare small-cap, mid-cap, and large-cap stocks, learn typical market-cap ranges and their limits, and see how FennEdge displays stock classifications.

You may hear “small capital,” “middle capital,” or “large capital.” In a stock-market conversation, the usual terms are small-cap, mid-cap, and large-cap. Cap is short for market capitalization: a way to describe how large a company is in the equity market.
Start with market cap, not the label
Market cap ≈ share price × shares outstanding. A company with 100 million shares outstanding at $10 a share has a market cap of about $1 billion. That is an equity valuation, not cash in the bank or annual profit.
A high share price does not necessarily mean a large company. For a closer comparison, read Share price, market cap, and float.
From nano to mega
These are the dollar bands currently used by FennEdge. Each band includes its lower bound and excludes its upper bound. They are useful reference points, not universal rules.
| Classification | Reference market cap |
|---|---|
| Nano-cap | < $50M |
| Micro-cap | $50M–$300M |
| Small-cap | $300M–$2B |
| Mid-cap | $2B–$10B |
| Large-cap | $10B–$200B |
| Mega-cap | ≥ $200B |
Small-cap describes smaller companies, mid-cap the middle range, and large-cap larger companies. Micro-cap and nano-cap go smaller; mega-cap names the very largest. Boundaries vary: Fidelity’s explanation starts small-cap at roughly $250 million, while SEC investor education describes microcaps as below $250 million or $300 million. Check the definition before comparing labels across platforms.
What the label can—and cannot—tell you
Size gives your research a starting point. Smaller-company shares may trade less actively and have less information available. You still need to inspect volume, spreads, float, and company disclosures separately.
Small-cap does not mean low-priced, and large-cap is no guarantee against a decline. Prices and share counts change; a company can move from one band into another.
Keep the classification in view with FennEdge
When market data is available, FennEdge shows Market cap and its classification while you research a stock. Pin Market cap as a top Tag to keep it visible. This historical interface example is not a current quote.

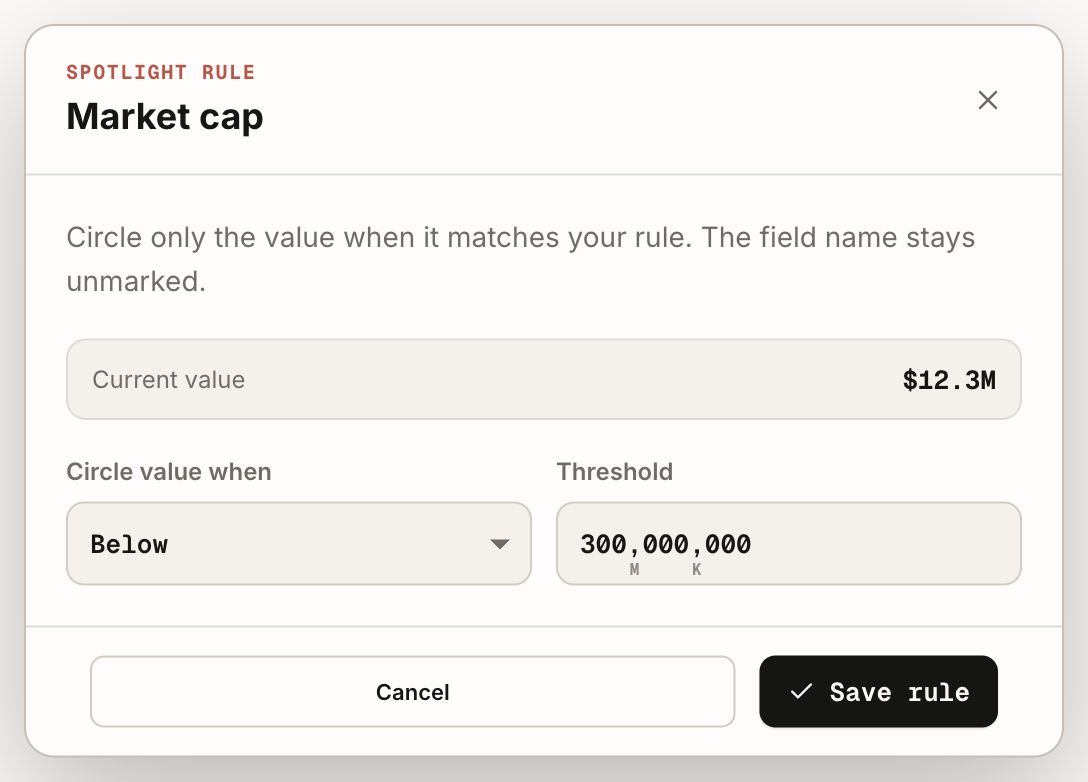
You can also customize a Spotlight condition for Market cap, such as Below 300,000,000, to emphasize values that match your research criteria. This customizes the highlight rule; it does not redefine the system’s market-cap bands.
Three questions to take away
Which boundaries does this label use? When was the market cap measured? Are shares outstanding being confused with tradable float? These questions are more useful than memorizing a category alone.
Keep the trading glossary nearby, and explore the dilution course when financing changes the share count.
This article explains common concepts; examples are not trading recommendations.