Research workflow · 8 min read
Researching a stock’s previous active days without turning history into a prediction
Research previous in-play days using catalysts, intraday paths, volume and corporate actions. Avoid hindsight, split-adjustment mistakes and missing-data assumptions.

A familiar stock returns to the movers list. You remember a large move last time, but “it did this before” is not yet research. Establish why it was active, when the information became public, and whether today’s security and capital structure remain comparable.
Treat previous active days as events to investigate
In-play commonly describes a stock drawing active-trader attention through news, unusual trading or price movement; it is not a universal legal classification. After finding dates in FennEdge In-Play Days, check coverage, availability and query status. Keep an unfinished current session separate from completed historical days.
Do not retain only the three strongest winners. Define a candidate set using consistent criteria over a stated period, then include rallies, reversals, short-lived activity and insufficient-data cases. Different selection rules produce different samples.
A real walkthrough: VEEA on October 5, 2026
Open VEEA in In-Play Days and establish the selected date before interpreting its shape. Both screenshots below come from the public site on October 9, 2026, using the guest preview rather than simulated data. The query found 18 active days over the past two years; October 5 was the latest day available in full. Earlier entries showed month labels and locked-day counts.
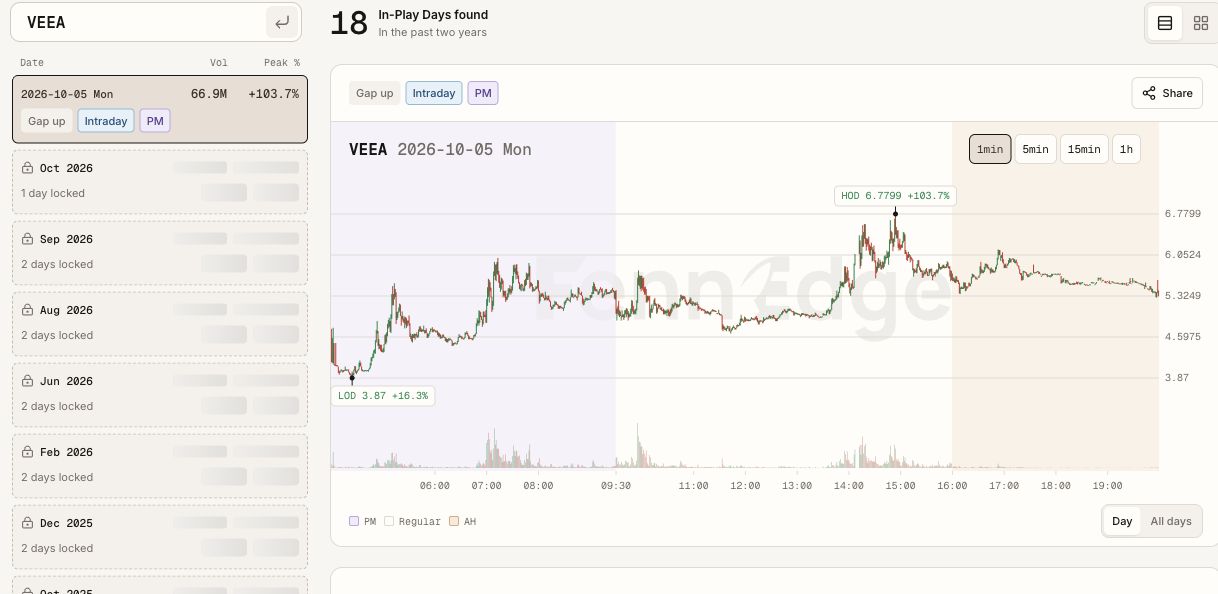
Read the selected row first: October 5, Vol 66.9M and Peak % +103.7%. The chart marks HOD at 6.7799. Its percentage is measured against the previous daily close used by the page, and its observed extremes include extended hours. This is neither an open-to-close return nor a trader’s realized return. Gap up, Intraday and PM describe different qualifying conditions; their percentages are not interchangeable.
Then read the time axis. PM, Regular and AH distinguish premarket, regular hours and after-hours in ET. The one-minute chart identified HOD at 14:54 ET and LOD at 04:24 ET: the low was in premarket and the high in regular hours. That distinction helps locate a source-research window, but the chart alone cannot establish which announcement caused the move.
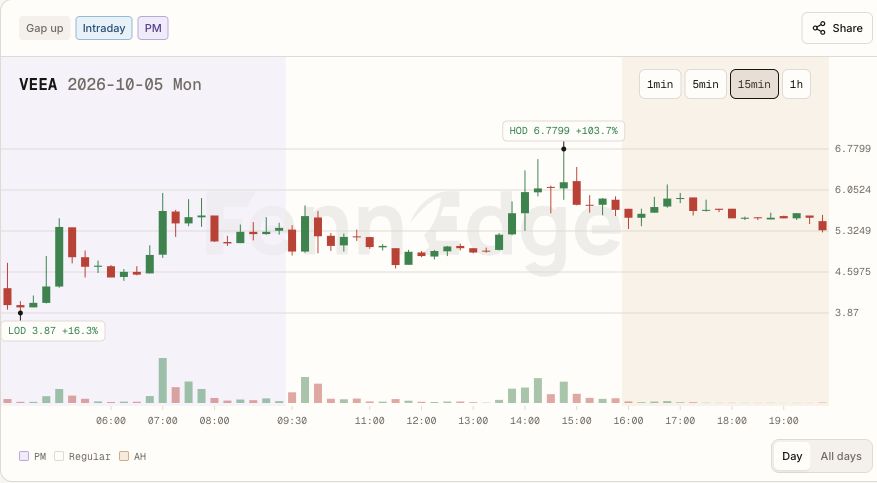
Fifteen-minute candles help compare broad stretches of price action and volume. A candle covers an interval; its position does not establish that the high occurred in the interval’s first minute. Nor does every one-minute fluctuation imply a separate news event. Use the broader interval to locate a window, then investigate finer data and contemporaneous sources.
Preserve a testable note: “VEEA, October 5; captured October 9; check information public before 14:54 ET; reconcile corporate actions, share units and the unchecked date.” Follow with issuer context in Research and dated sources in Desk. This produces research questions, not a claim that today will repeat the historical path.
Confirm the issuer and security before comparing symbols
Symbols and names can change, and a post-merger issuer can differ from the old business. Nasdaq’s Daily List covers corporate actions such as listings, delistings and symbol changes. Reconcile issuer disclosures and security continuity; a matching ticker alone is insufficient.
In FennEdge Research, preserve issuer name, security type, historical symbols and applicable dates. SPAC combinations, splits and issuance can change the comparison. See SPAC mechanics and share-count changes.
Align information time with price time
| Record | Keep distinct |
|---|---|
| News | Original publication, later reporting and your observation time |
| Filings | Event date, filing date and covered reporting period |
| Price | Premarket, regular hours and after-hours observation windows |
| Volume | Cumulative volume then, final daily volume and coverage |
| Conclusion | Confirmed facts, interpretations and unknowns |
Market times here use ET. Suppose an issuer publishes at 08:10, trading accelerates at 08:12 and an outlet republishes at 10:05. Do not describe 10:05 as the original catalyst time. Nearby timestamps alone also do not establish causation; read the contents and later clarification.
Follow the stock-move research workflow to original sources and preserve versions and lookup times in FennEdge Desk. If the first publication time cannot be established, record it as unknown. A chart does not supply missing source evidence.
Reconcile splits and measurement conventions first
Assume a later 1-for-10 reverse split. A historical unadjusted $1.20 corresponds to $12 on a split-only comparison basis. Comparing raw $1.20 with today’s $12 can mistake a unit change for a tenfold return. The SEC reverse-split explanation provides the underlying concept.
Record whether prices and volume are adjusted and which share units apply. Adjusting price while retaining old-unit volume can corrupt turnover calculations. Subsequent offerings, exercises or redemptions can also change float.
Ten million historical shares traded does not establish comparable supply today. Use price, capitalization and float to interpret current counts; do not use today’s float as the denominator for every historical day.
A useful comparison goes beyond the largest percentage move
Suppose two days each reached a 30% maximum gain. Day A followed a signed agreement disclosed before the open; day B followed an unconfirmed repost. Trading persisted through regular hours on A but clustered near the open on B. Equal maximum gains do not equalize source quality or the intraday path.
Keep event type, source, information time, active session, volume distribution and corporate actions for each day. Without minute data, preserve day-level facts but do not narrate a particular minute’s high. Partial coverage is not evidence that missing intervals had no trading.
Connect historical research to today’s record
Move from FennEdge Scanner to available dates in In-Play Days, then verify events and capital structure in Research. These steps discover activity, identify dates and investigate context respectively. Preserve unavailable-data states when necessary.
In Desk, write what matches, what differs and what remains unverified. Later compare your fills and contemporaneous notes in FennEdge Journal. Final daily highs, volume and later filings must not be retroactively inserted into what was knowable then.
FAQ: Must every historical day be studied? Narrow the set with consistent documented criteria. Can the strongest past day be a template? It can be a case study, not a reliable forecast of the current session.
Sources checked October 4, 2026: Nasdaq corporate-action information and SEC split guidance. Other event scenarios and numerical examples are hypothetical; the explicitly labeled VEEA interface examples are real results checked October 9, 2026.
This article explains common concepts; examples are not trading recommendations.