
Market events
WFF’s October 9 surge: historical In-Play Days and changing share supply
Compare real WFF In-Play Days charts with the October 9 surge. Examine prior spikes, next-day trading, completed cashless warrant exercise and SEPA share issuance.

WFF closed roughly 500% higher on October 9, 2026, after several earlier explosive active sessions. On August 17 it reached $10.71 around midday but finished at $2.02. October 9 followed a different path: a morning decline gave way to an afternoon advance and a late-session high. Comparing those In-Play Days, alongside the company’s changed share supply, offers a more useful reading of the event than the headline gain alone.
This review uses actual FennEdge minute-chart captures, third-party regular-session daily prices and issuer filings. Event times are EDT (UTC−4); reviewed October 12, 2026. WFF is WF Holding Limited, whose principal business is Malaysian fiberglass-reinforced plastic manufacturing.
Earlier active days: large peaks, different closing structures
Open WFF in In-Play Days to compare previous active sessions. The selected dates below provide concrete contrasts in peak formation, retracement and next-day trading; they are not a statistical forecast.
| Session | Approximate volume | Regular-session high / close (USD) |
|---|---|---|
2026-08-07 | 31.2M | 10.53 / 2.30 |
2026-08-17 | 86.0M | 10.71 / 2.02 |
2026-08-18 | 25.9M | 2.80 / 2.22 |
2026-09-25 | 3.7M | 2.89 / 2.40 |
2026-10-09 | 146.1M | 19.44 / 12.29 |
Daily figures: Stock Analysis. Chart captures include extended hours. Their Peak % uses the tool’s own prior-close series and observed high; do not mix it with close-to-close returns or substitute a premarket high for a regular-session high.
August 17: midday acceleration, then extensive retracement
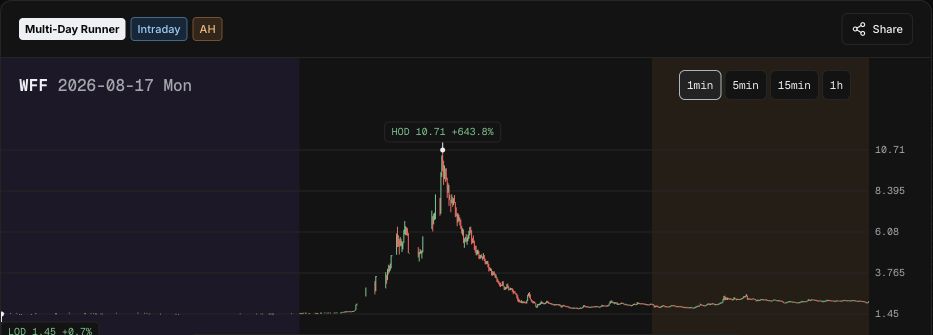
The chart shows an advance through the morning, acceleration toward noon and a $10.71 high in the 12:08 minute bar. Price then repriced sharply lower and returned to roughly $2 during the afternoon. The regular close was about 81.1% below the high. August 7 also produced a double-digit peak and a much lower close.
The repeated observation is a rapid expansion of the traded price range followed by a failure to sustain the elevated area. Review the post-acceleration structure: were higher lows rebuilt, did trading remain near the peak, or did the afternoon return toward the launch area? These are observable questions. The shape alone does not identify participants or establish manipulation.
August 18: continued activity at a much lower price range
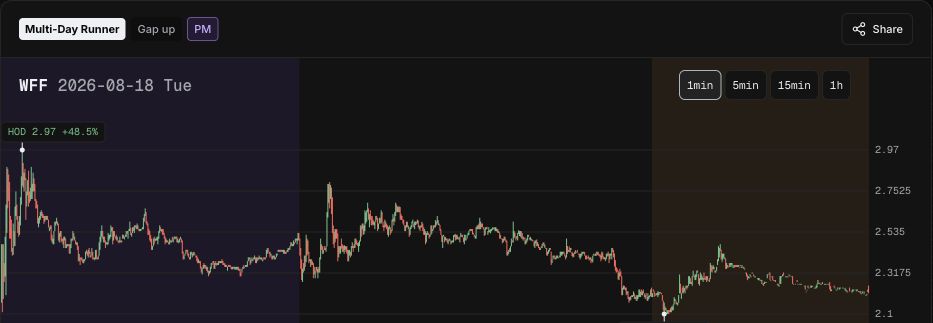
Activity continued the next day. The tool labels the session Multi-Day Runner, Gap up and PM; its observed $2.97 peak occurred at 04:23 ET. Subsequent regular-session trading did not regain that premarket high, much less the previous day’s double-digit area.
Attention can persist without acceptance of the earlier high-price range. MDR categorizes active sessions that have already occurred; it does not predict another advance. The In-Play Days research guide explains how to separate the first active day from subsequent sessions.
September 25: a smaller active session is also informative
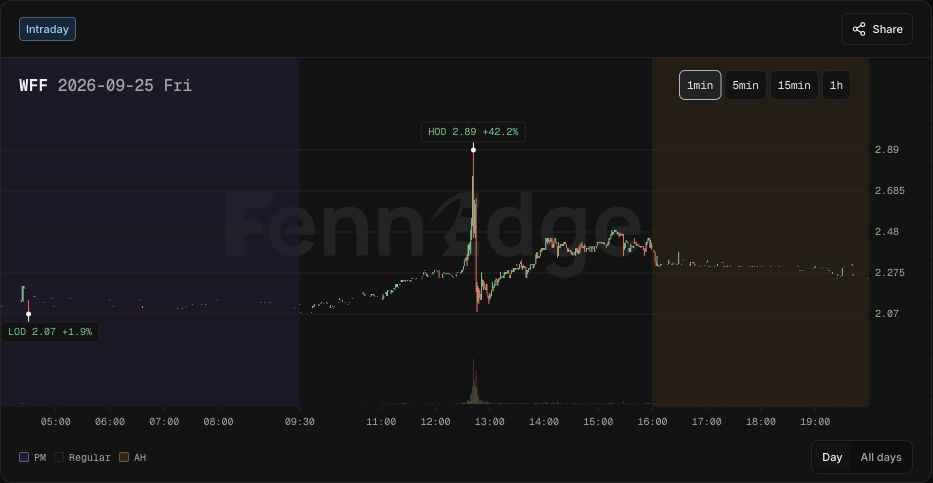
This smaller session peaked at $2.89 in the 12:42 minute bar, fell abruptly and then resumed trading in a lower range. Its amplitude and activity differed substantially from August 17. A stock’s largest historical spike should not become its entire behavioral profile.
Keep peak timing, the pre-acceleration range, post-peak trading and next-day behavior together. These selected active days are neither the complete trading history nor a sample controlled for news, float and market conditions.
October 9: a morning low, sustained afternoon advance and late retracement
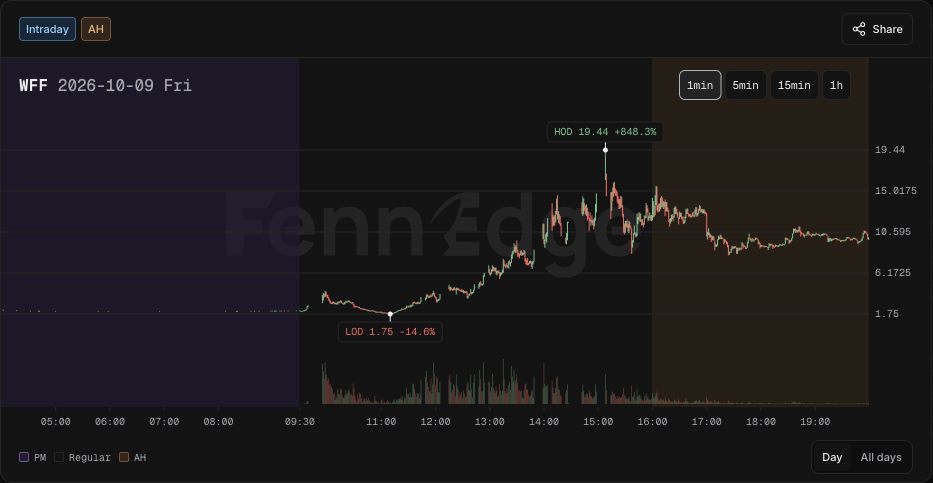
The 11:10 minute bar recorded the $1.75 low. Price subsequently rebuilt, accelerated during the afternoon and reached $19.44 at 15:08. Unlike August 17’s midday peak and extended unwind, this session continued to reprice upward into the afternoon.
Two observations belong together: substantially more of the advance remained at the regular close than in the August spike, yet the close was still approximately 36.8% below the high. A closing return cannot replace the intraday path.
Nasdaq’s halt recordscontain eleven distinct LUDP pauses, beginning at 09:39:21.616 and ending with a pause starting at 15:09:35.643. Repeated interruptions fragment continuous trading. Compare the traded range, spreads and sustained activity after reopening; minute bars do not reconstruct reopening-auction order depth. See LULD and reopening.
Eleven pauses and trade-resumption times (EDT)
| Pause began | Trading resumed |
|---|---|
09:39:21.616 | 09:55:14 |
11:44:27.200 | 11:49:27 |
12:05:49.236 | 12:15:50 |
12:43:40.516 | 12:48:40 |
12:54:36.630 | 12:59:36 |
13:49:51.770 | 13:59:56 |
14:04:32.320 | 14:09:32 |
14:19:30.616 | 14:24:30 |
14:27:11.390 | 14:42:42 |
14:58:34.113 | 15:08:34 |
15:09:35.643 | 15:14:35 |
Nasdaq Trading Halt Search; duplicate halt timestamps consolidated. Resumption uses Resumption Trade Time. All entries carry LUDP.
Compare the charts, but refresh the capital-structure label
These charts largely describe trading after June’s financing. The June 11 Form 6-Kreports 4,032,258 units sold for $1.24 each, raising approximately $5 million. Each unit combined one share with a warrant covering ten shares. The alternate cashless option, available from the tenth day after issuance, delivered 90% of the underlying share count.
The interim financial-statement notesconfirm full alternate cashless exercise on June 22: 36,290,322 shares were delivered without further exercise cash. Together with the placement shares, the two steps added 40,322,580 shares. June 30 outstanding shares were 45,360,598, about nine times the split-adjusted December 2025 count of 5,038,018.
This is completed dilution, not a hypothetical warrant-overhang calculation. It illustrates why warrant termsmatter: large share delivery need not provide a second cash payment to the issuer.
The original June filing also describes a twelve-month purchaser lock-up. Tradable supply requires checking its scope, later waivers or amendments, and resale-registration conditions. Newly issued shares are not automatically freely saleable float. Both an obsolete small-float label and an assumption that every new share is immediate selling supply can mislead.
The July prospectus supplementlists 41,919,934 ordinary and 3,440,664 Class A shares: the same combined total as June 30. Reclassification is not a reduction in total outstanding shares. See price, market cap and float for the measurement differences.
The July equity facility had already delivered shares
A separate July 30 SEPA provided up to $30 million over twenty-four months. Its disclosed purchase formulatakes the lower of $1.01 and half the lowest closing price in the preceding 180 trading days, subject to a $0.10 floor and corporate-action adjustments. A temporary secondary-market peak does not automatically reset that formula.
The October 2 operating reviewreports actual usage: the investor prepaid $3 million on July 31; 750,000 commitment shares were issued; and 3,600,000 purchase shares had been issued for $1.89 million, deducted from that prepaid credit. The commitment shares are separate, and the $1.89 million was not an additional cash receipt.
Dividing $1.89 million by 3.6 million gives an average purchase-share issue price of approximately $0.525, excluding commitment shares and fees. This explains how the financing translated into delivered shares. It does not establish that these shares were sold on October 9 or identify who drove the move.
The practical background is specific: repeated sharp price expansion and contraction occurred alongside a changed share base and an active financing mechanism. Refresh the old float assumption and distinguish facility capacity from actual issuance. The shelf-registration guide covers related registration and issuance distinctions.
Keep a source-linked record in FennEdge
Start in WFF’s In-Play Days directory and examine acceleration, the post-peak range and the next session separately. Full historical charts require the appropriate account entitlement. Purple, dark and brown areas represent premarket, regular trading and after-hours. The two August captures show the price panel only; unavailable neighboring dates are not filled in or used as evidence for these paths.
Then use the WFF stock page and FennEdge Research to organize the placement, completed warrant exercise and later SEPA deliveries. Preserve filing dates and reporting periods alongside each number.
Record the verified chart structure and share changes in FennEdge Desk. Review personal orders, fills and reopening-stage execution in FennEdge Journal against the information available at the time, rather than the completed hindsight chart.
The evidence supports a useful distinction: WFF has repeatedly traded through rapidly expanding and contracting ranges, but October 9’s afternoon path differed from the August examples. Understanding it requires both historical price structure and current share-supply evidence, without forecasting the next session’s direction.
Sources and timing
Minute charts: FennEdge In-Play Days (August 17–18, September 25, October 9; actual product captures). Daily prices: Stock Analysis. Trading interruptions: Nasdaq halt search and halt codes. Issuer documents: June 11 Form 6-K, July 31 Form 424B5, July 31 Form 6-K, October 2 Exhibit 99.1 and Exhibit 99.2.
Filings establish financing context; charts describe observed prices. Their juxtaposition does not automatically establish causation. Unverified X / Twitter summaries are not treated as catalysts, and individual participants’ session trading is not established. Reviewed October 12, 2026; later disclosures require a separate update.
This article explains common concepts; examples are not trading recommendations.